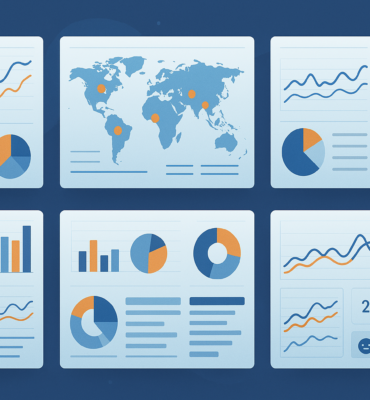
Survey Dashboard
Survey Dashboard
Software: Power BI, SharePoint, MS Excel
Objectives
Automate the analysis of survey data trends for internal review.
Develop interactive visualizations to enhance data interpretation.
Enable category-based comparisons for deeper insights.
Present response percentages across different survey categories.
Provide key analysis displays such as top responses, averages, and percentage distributions.
Solution
Developed a Power BI dashboard to dynamically visualize survey data.
Automated data trend analysis by extracting and processing survey results.
Enabled category-based comparisons to assess responses across various segments.
Presented percentages of responses to highlight trends and variations.
Designed interactive analysis tools to display top responses, averages, and key metrics.
Stored and managed survey data in Power BI on SharePoint for accessibility and collaboration.
Benefits
Enhances decision-making by providing clear insights.
Improves efficiency through automated data analysis and reporting.
Facilitates internal strategy development by identifying trends and areas for improvement.
Ensures secure data storage and access via SharePoint integration.
Checkout Recent Cases

