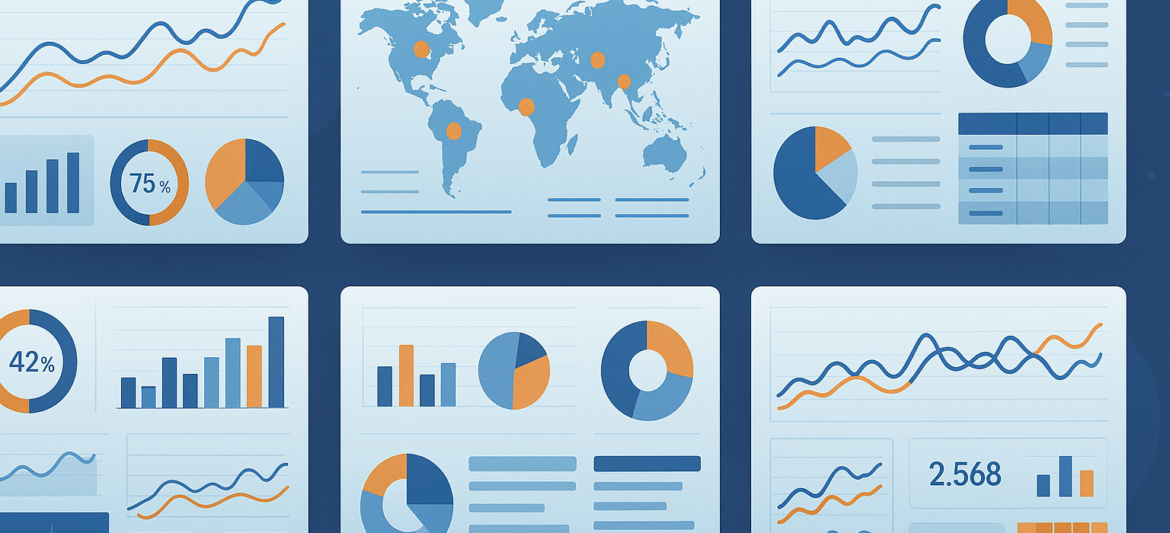
BI Dashboard
Study Business Intelligence Dashboard
Software: Power BI, MS Excel
Programming: SAS, VBA
Programming: SAS, VBA
Objectives
Automate the review of data trends for internal analysis.
Enable rolling average calculations to identify long-term trends.
Provide comparative analysis of state and national data.
Generate insightful reports with counts, rates, and trend visualizations.
Solution
Developed a Power BI dashboard to visualize data trends in real-time.
Automated data trend analysis using SAS, incorporating rolling averages for better trend assessment.
Enabled comparative analysis of U.S. state and national data, highlighting key differences.
Integrated dynamic trend charts for visual representation of data patterns.
Provided count and rate calculations to support decision-making.
Benefits
Enhances data-driven decision-making by automating trend analysis.
Improves comparative insights across states and national data for better interventions.
Streamlines internal reporting, reducing manual effort in trend reviews.
Offers real-time visualization of trends, enabling proactive responses.
Checkout Recent Cases

